
Spring is getting earlier. Find out how it’s changed in your town.
Readers told us how spring has changed where they live. Our map shows where leaves are sprouting sooner.


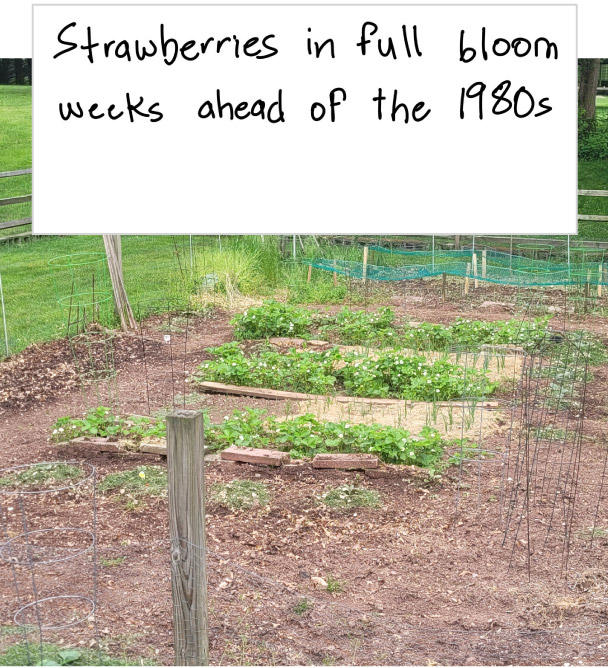
Ken Lyons, 77, knows when strawberry plants used to bear fruit in Lebanon, N.J. In the 1980s, strawberries came within a few days of his son’s birthday on June 11. These days, Lyons’s strawberry plants peak in May. When his son, now 45, visited home for his birthday a few years ago, he was disappointed to find the strawberries already gone.


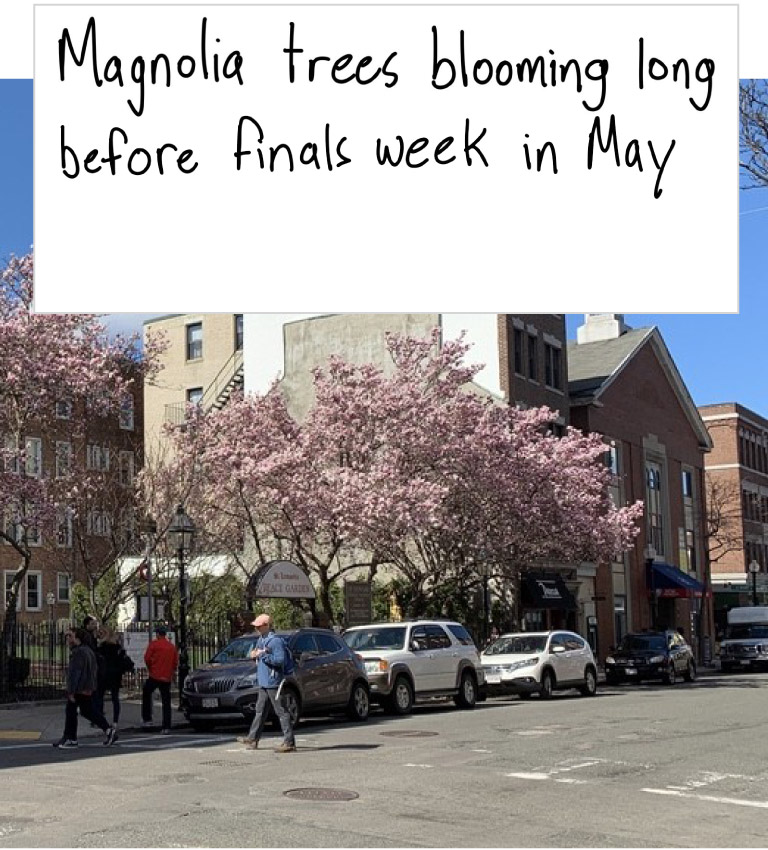
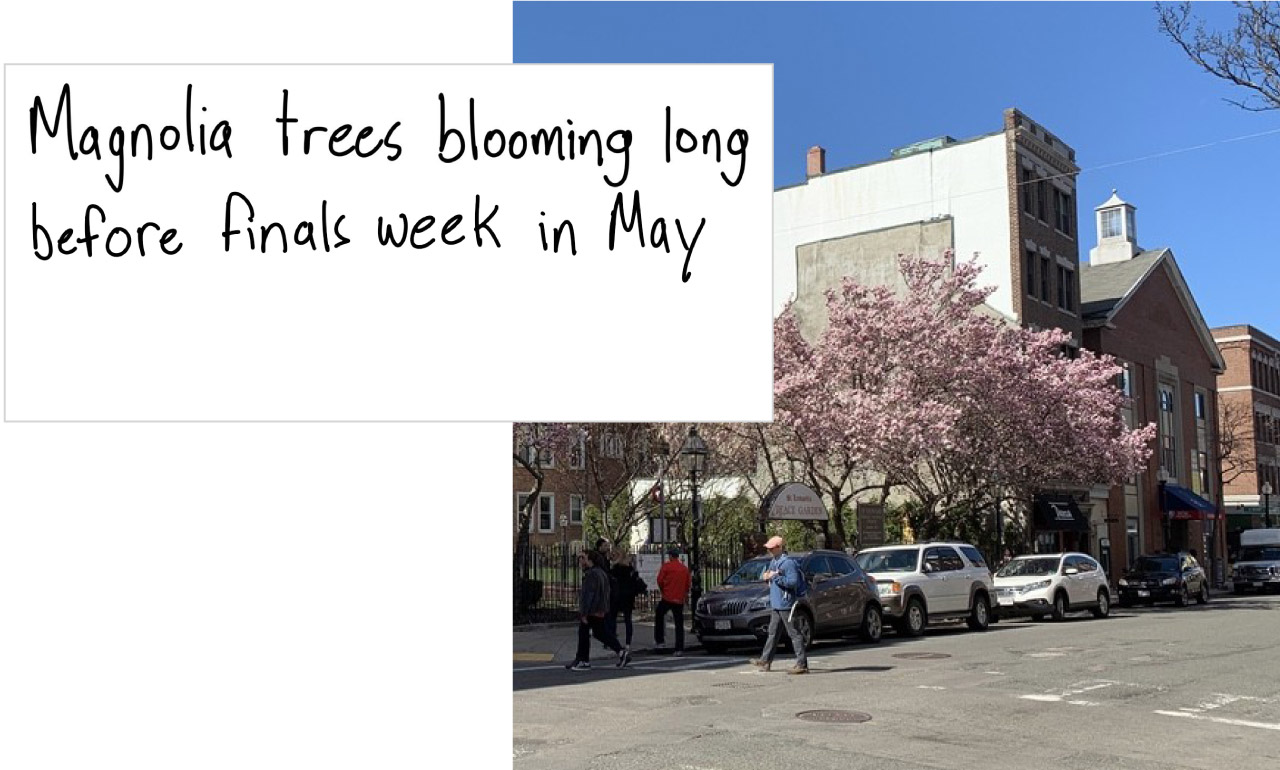
Michael Dornbrook, 71, knows when the magnolia trees used to bloom in Boston. As a student at MIT in the early 1970s, he remembers seeing their pink and white petals on his way to take his final exams in the second and third week of May. Now the magnolias often bloom in April.


As global warming nudges temperatures higher, memories of the past offer an informal account of how the seasons have changed. A formal account comes from the USA National Phenology Network — phenology is the study of seasonal change — which reports the annual appearance of spring’s first leaves in the contiguous United States since 1981.
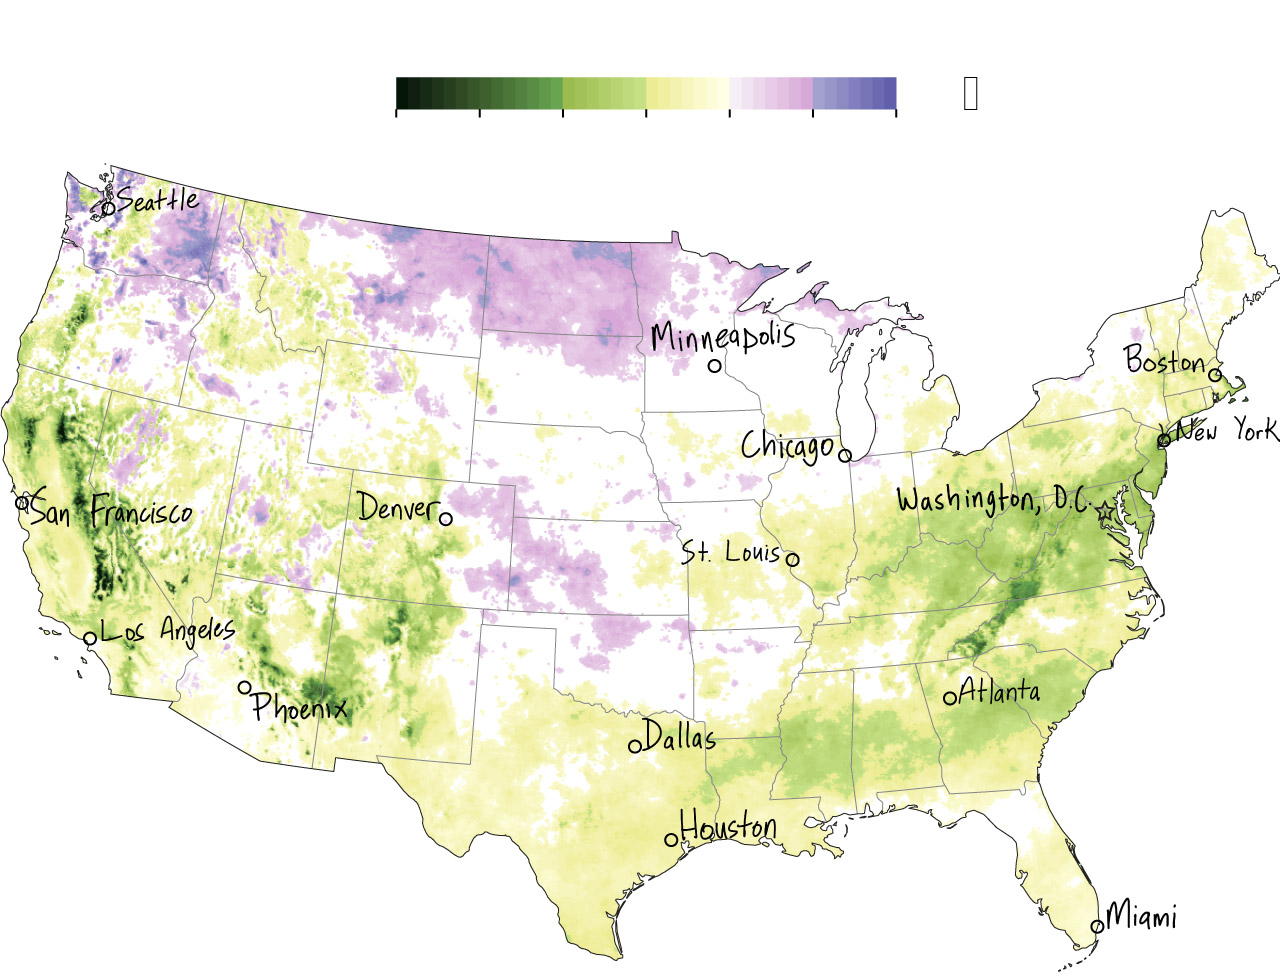
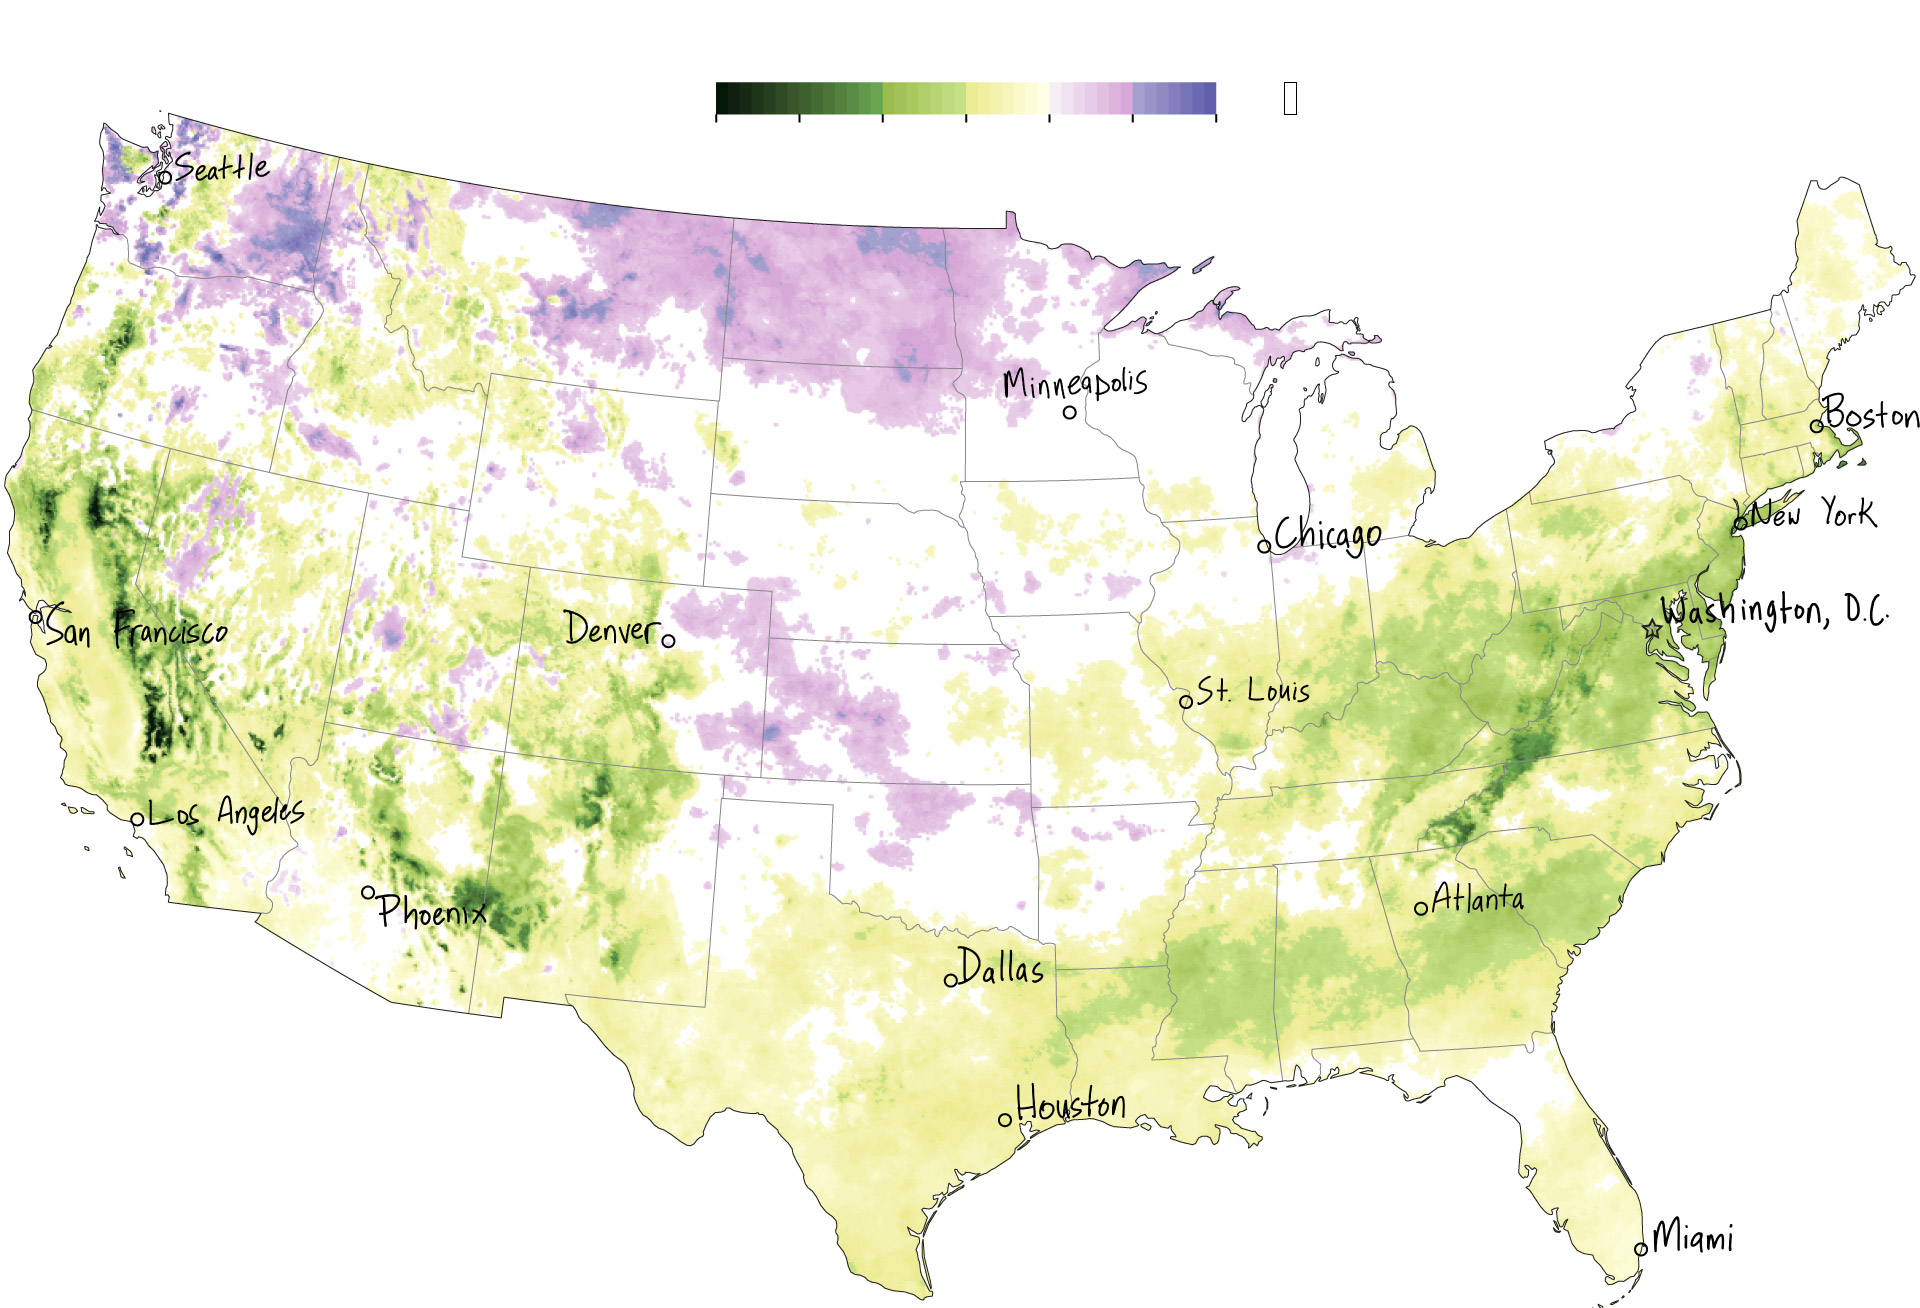
Spring is trending earlier across a vast U-shaped area of land stretching from coast to coast, according to my analysis of their data.
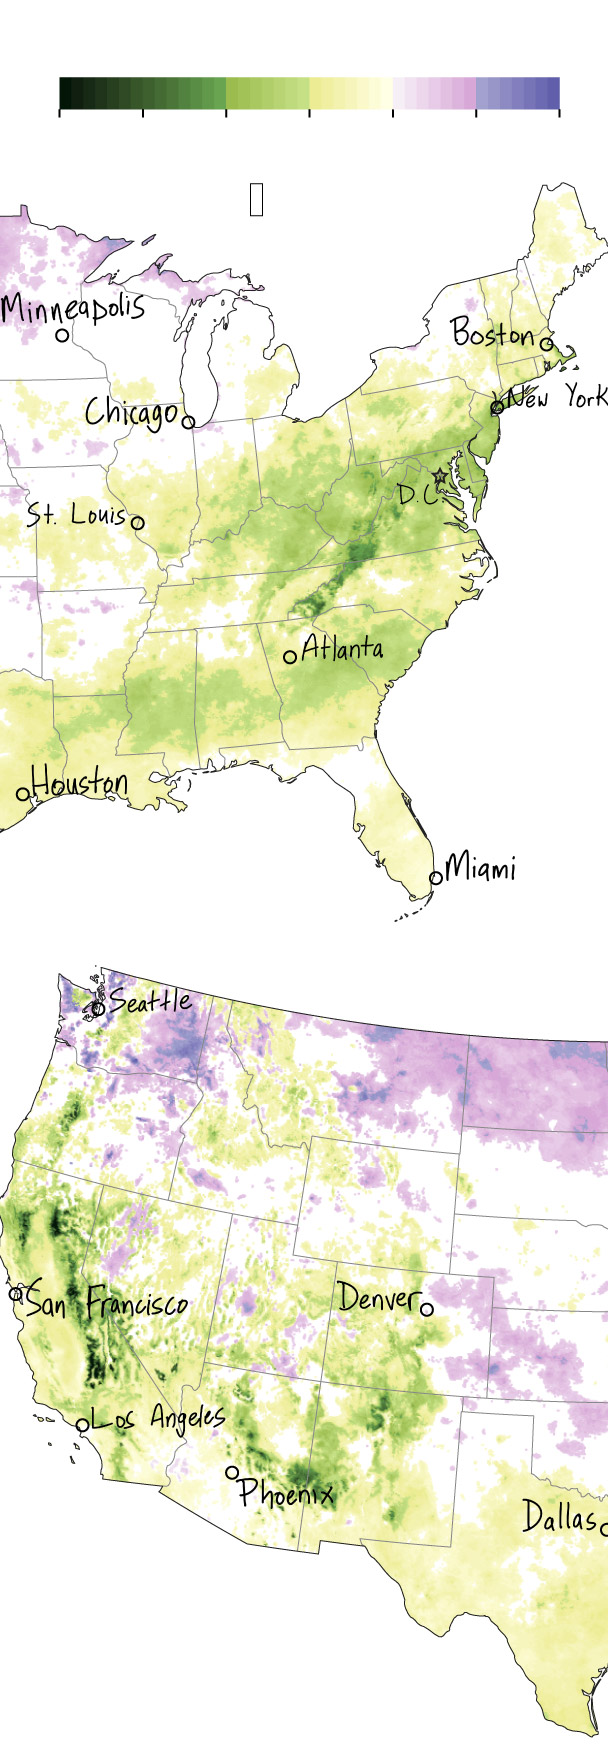
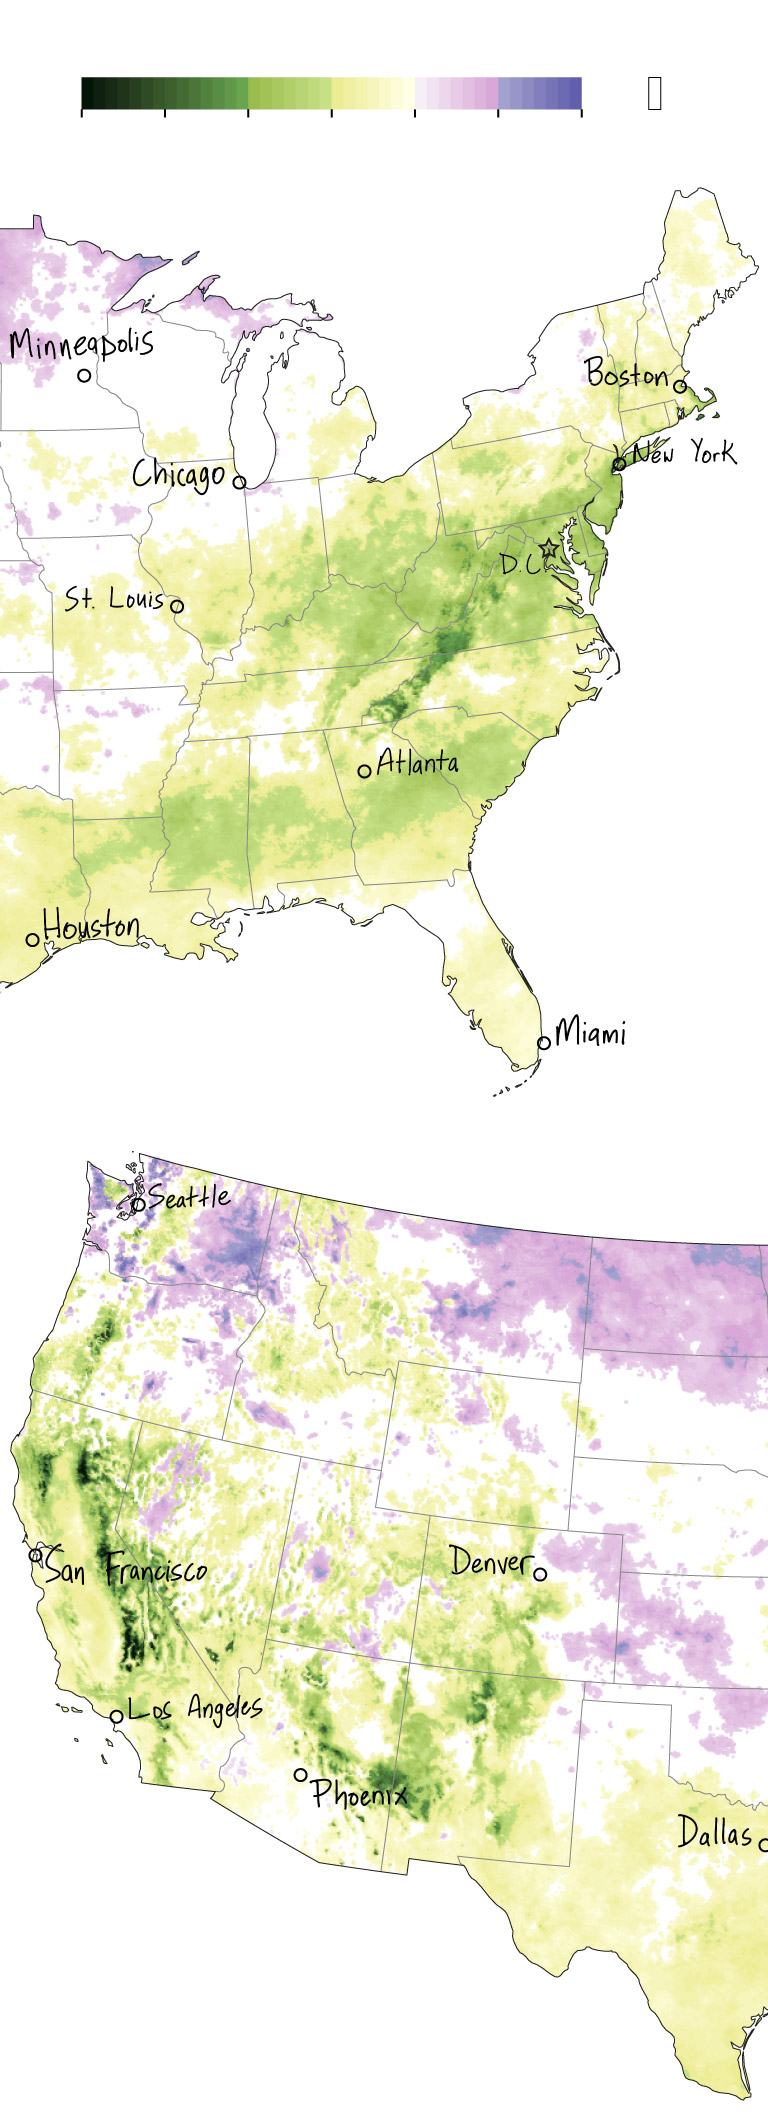
Spring’s arrival appears especially accelerated at higher elevations. In parts of California’s Sierra Nevada, for instance, trees that used to sprout leaves in mid-May now tend to do so in early April. The reason is unclear, climatologists told me, but it could be that snow has grown scarcer in the mountains, which allows the ground to absorb more of the sun’s heat, creating a feedback loop.
To know when leaves appear, it is not necessary to hire a million people across the country to vigilantly monitor trees all day. As winter fades, plants respond to the gradual accumulation of heat. So instead of watching trees, phenologists track temperature, waiting for “a set of conditions that are associated with the biological start of spring,” said Theresa Crimmins, the director of the National Phenology Network.


The data reveal broad trends in spring’s arrival time, but there is too much annual variation to forecast when leaves will appear in any given year. In a little less than half of the country, there is no clear trend at all. In some parts of the Midwest and Northwest, leaves tend to show up later than they used to.
Yet earlier springs have become more likely than later ones. In the contiguous United States, the area of land where spring leaves tend to appear earlier is four times the size of the area where leaves are trending later. And leaves’ average arrival date roughly matches the average temperature at the start of each year, according to data beginning in 1900.
When people describe how spring has changed, they often talk about things other than leaves. Hilton Dier III, 62, of Middlesex, Vt., talks about sap.
To make Vermont’s famous maple syrup, you collect sap through a tap inserted into the trunk of a sugar maple tree. But you can’t tap a tree at any time of year. You need to wait until the temperature is above freezing during the day but below freezing at night. Those specific conditions act like a pump, bringing sap up from the tree’s roots and into its trunk.
Here’s how Dier knows that people tap their trees earlier than they used to. Vermont has a tradition called town meeting day, where everyone gathers to argue with their neighbors about things such as budgets and zoning. It’s held every year in the first week of March. “You used to be considered kind of kooky,” Dier said, “if you tapped your trees before town meeting day.”
But now, daytime temperatures rise above freezing throughout the winter. Dier knows people who tap their trees in January and February. Some years, people get sap runs in December. “Sugaring season is completely off,” Dier said.


In Dallas, the whole growing season is off. When I talked to Stan Aten, 67, president of the Rainbow Garden Club of North Texas, he was preparing for this weekend’s big flower show at the Dallas Arboretum. The show is held every year in mid-March, but Aten reckons that might change. Daffodils are blooming earlier and earlier.
“It’s getting so warm that we might have to move it up a week or two to hopefully have something to show,” Aten told me.


It seems nearly everything about growing plants in Dallas has changed since Aten moved there in 1986. He used to always plant his tomatoes on March 17, but this year he planted them in February. His Japanese maples, Chinese fringe flowers, and day lilies leaf out earlier than they used to. He knows gardeners who erect shade cloths to protect their plants from late afternoon heat. “You never would have heard of such a thing years ago,” Aten said.
It’s enough to exasperate even a vigilant gardener. As Aten put it: “I’m seeing all kinds of stuff that shouldn’t be, that is.”
Check my work
I downloaded the annual leaf index gridded data from the USA National Phenology Network and calculated the linear regression in each grid cell, filtering out cells with p-value at least 0.5. I got the list of U.S. city coordinates from this GitHub repository and joined them to the gridded data, filtering out coordinates that did not fall inside any grid cell. Historical temperatures are from the National Oceanographic and Atmospheric Administration, and historical leaf index dates are from Mark D. Schwartz of the University of Wisconsin at Milwaukee, who emailed me the data file.
I published the code to make versions of the graphics in this article in three computational notebooks: the map of leaf index trends, the chart comparing leaf index trends in selected cities, and the chart comparing leaf index and temperature from January to May.
You can use the code and data to produce your own analyses and charts — and to make sure mine are accurate. If you do, email me at harry.stevens@washpost.com.


No comments:
Post a Comment